


Dr. Walter Kemmsies
Chief Economist, The Kemmsies Group
forecasting freight…
Welcome to the FuturePorts Blog. Written by highly regarded economist Walter Kemmsies, our blog focuses on the “big picture” economic trends that are impacting Southern California’s goods movement system. Each month we’ll publish an article that will focus on the economic outlook for the freight industry. One more way FuturePorts is educating our stakeholders about the critical nature of the supply chain to our region.
May 2023
A Glimmer of Hope
Dr. Walter Kemmsies, Chief Economist
The Kemmsies Group
There may be a glimmer of hope for the container volumes handled at U.S. ports to stop declining and potentially even grow during the second half of the year.
Container volumes, loaded imports in particular, have been declining nationally since August 2022, with the rate of decline gaining speed through at least March this year. The declines are not evenly spread across ports but across the largest port authorities the volumes are down. Along with the decline in loaded import containers, empty container exports are also down a lot which is a troubling indication that Asian manufacturers are not asking for containers so they can ship their goods to the U.S. If the manufacturers aren’t asking for containers, it means they are not getting purchase orders from the U.S.
In previous commentary here, it was pointed out that Retailers, in particular the larger ones, have very high levels of inventories. Recent Wall Street Journal articles have reported that the larger retailers were selling some of their excess inventories to downstream retail discounters. Despite the efforts by these retailers to reduce these inventories, they remain at very high levels. General Merchandise Stores (large importers of goods) may have been holding $10 to $15 billion of excess inventories. However, it is important not to over generalize because many retailers have reported that their level of inventories was at levels that they wanted them to be. In the charts below, the grey bars represent periods of recession.

Another very significant category of imported goods relates to residential real estate. These goods include home building materials, decorating materials, furniture, flooring, and appliances, to list a few. Home building activity tends to create more demand for real estate-related commodities than sales of existing homes, for obvious reasons. The chart below, which gives the annualized level of the monthly data, shows how privately owned new housing starts have evolved over the last 60 years.

The long term average number of privately owned new housing units started is around 1.4 million per year. Using that as a benchmark, from 2009 to 2019 the average level was much lower. According to the Federal Home Loan Mortgage Corporation (commonly referred to as Freddie Mac) there is a housing deficit in the U.S. that it estimated a few years ago to be close to four million units.
The most recent peak for new units started was in April 2022 when 1.8 million units were reported. However, as the Federal Reserve started raising interest rates, mortgage rates also increased. The Fed created a lot of uncertainty about how high and how fast they would increase interest rates, so it became difficult to set mortgage rates. Mortgage rates rose above 7% in November 2022 but began decreasing to 6.4% by May 4th this year. A few months later, new housing unit started at 1.3 million and since February they have been slightly above 1.4 million.
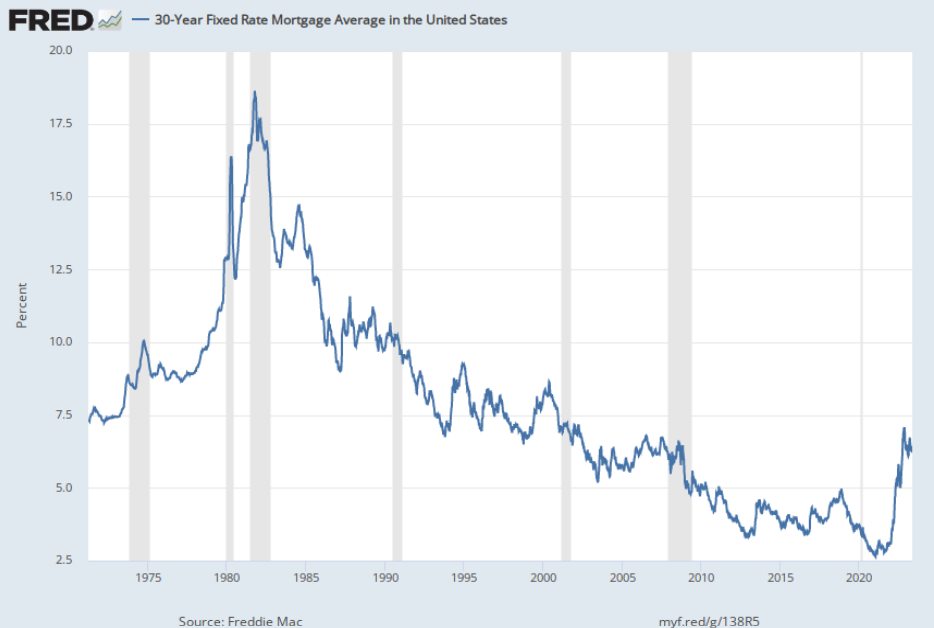
It is too soon to tell if the recent mild recovery will be sustained. The Fed’s aggressiveness has damaged segments of the economy, the recent spate of banking failures is a good example of that. There may be other damage that surfaces, and the potential for that to cause a significant recession is not negligible. Barring an extreme event like that, it is possible that the residential real estate growth will resume. There are various signals from the financial markets and the home building industry indicating that the growth recovery is sustainable. Let’s hope they are right.
February 2023
Trying to Forecast Container Volumes for 2023
Dr. Walter Kemmsies, Chief Economist
The Kemmsies Group
One of the major items for budget committees at transportation service providers and contract renewal negotiations, is the outlook for container volume flows in 2023, as well as for the 2024 fiscal year for entities that have one that begins in the middle of the calendar year. Forecasting is a notoriously difficult endeavor. However, the pandemic and the reactions to it have made it dramatically more difficult to forecast. While the pandemic seems to be coming to an end, the reverberations from all of the reactions are still clouding the outlook. The ensuing volatility since 2020 is very evident in container port data. Since imports are about 50% of the larger container port volumes, the focus here is primarily on them.
Two types of uncertainty occurred with the emergence of the global pandemic in 2020. The first concerned the seriousness and duration of the pandemic. Would Covid-19 evolve into a less lethal virus, and if so, over what time horizon would that happen. The second type of uncertainty is driven by the reactions of policymakers, consumers, and companies to the impacts of the pandemic. These reactions may have created significantly more uncertainty. Government stimulus programs to the tune of trillions of US dollars in the US and trillions of euros in Europe, were larger than those during the Global Financial Crisis of 2008 – 2009. The Federal Reserve and the European Central Bank cut short term interest rates to zero percent and offered unlimited borrowing to banks and in the US for the first time to companies as well. The result was a historically unprecedented surge in consumer spending on goods while they did as much as possible from home.
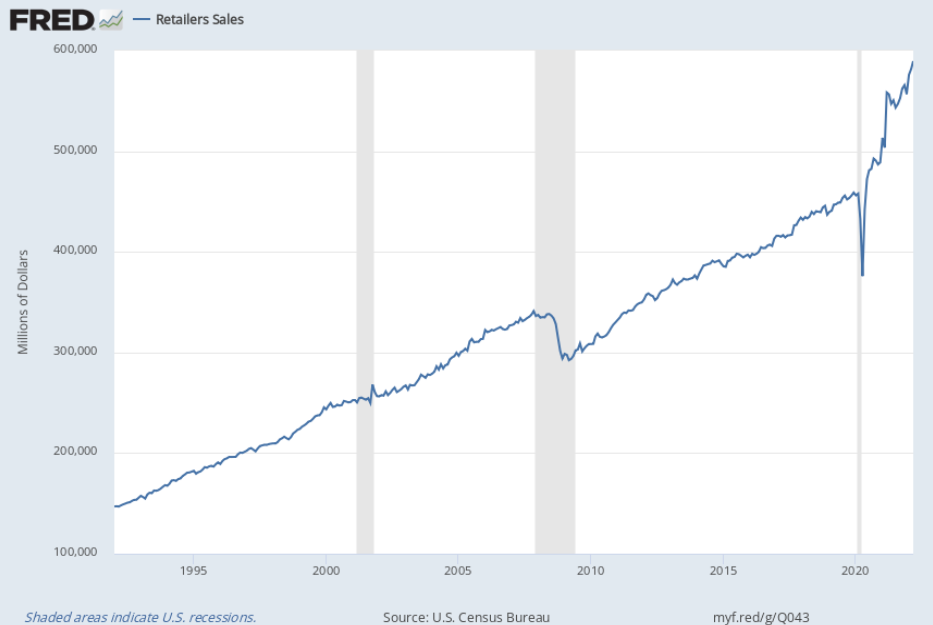
Some of the spending was for arguably rational reasons. Working from home, attending school from home, and spending more leisure time at home required upgrading residences to support that. New furniture, more leisure clothing, and investment in social distance sports equipment were also required. It is also likely that there was a lot of boredom shopping online since bricks and mortar stores had shut down. The chart below shows monthly sales for General Merchandise Stores (retailers with a large number of types of merchandise, like a department store) and for Retailers (all retailers, large and small). In the trade world, we look at Retailer Sales as opposed to Retail Sales because the latter includes items like gasoline and automobiles that are not containerized.

In the beginning of the pandemic China had shut down and reopened within a few months, but during that period other economies were shutting down. With Retailer sales surging and imports at low levels, inventory-to-sales levels dropped to historically low levels. As the US economy reopened, stores shelves were laid bare. General Merchandise Stores bottomed out sooner than Retailers did and by early 2022 were clearly overstocked. Many large retailers reported being overstocked in the Q1-2022 earnings calls with Wall Street. These retailers were able to pay the soaring spot market rates for space on container ships. Smaller retailers saw their inventory-to-sales ratio drop even lower before finally beginning to recover. However, they have not reached pre-covid inventory-to-sales level.

Once the vaccines for Covid-19 became available, Americans started going out more. This is very evident in Leisure & Entertaining data, as well as in the Transportation Security Administration data. (The TSA published how many people were processed at US airports the previous day and has data going back to 2018.) As Americans started to travel more, Retailer sales started growing more slowly and have declined in the last quarter of 2022.
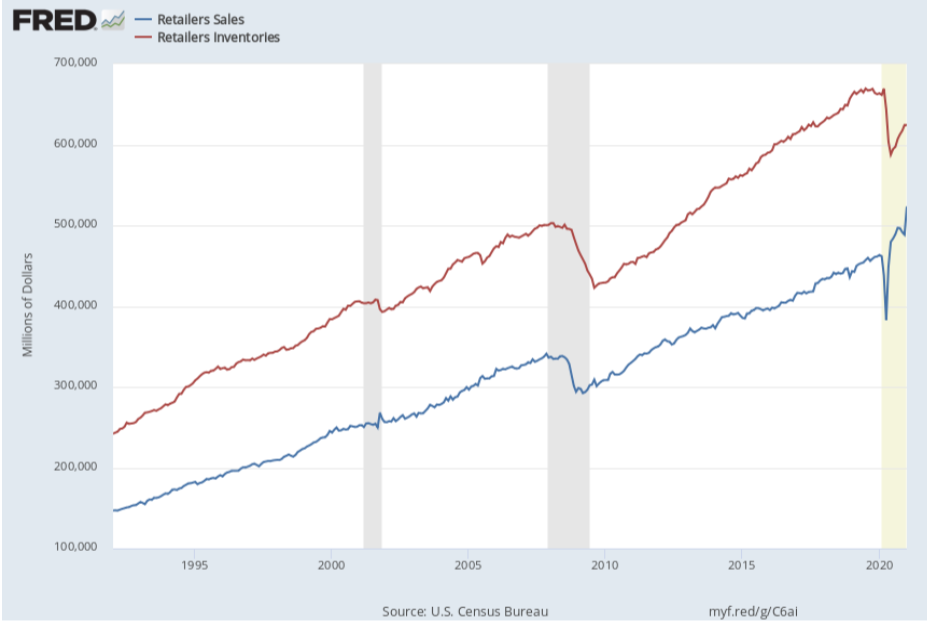
Retailers now have slightly above trend level inventories. However, the General Merchandise Stores’ inventories are significantly above trend levels. General Merchandise Stores have been de-stocking since the first half of 2022, nonetheless it appears that they are still way above a level needed for pre-pandemic consumer spending patterns. However, it is worth noting that their inventory to sales ratio is back in line with the average prior to Covid-19, which reflects that they have gained share of the consumers’ wallets. This may reverse over the next several years since smaller retailers’ sales have grown faster than those of General Merchandise Stores. Nonetheless, the key driver for container volumes is the reduction of General Merchandise Stores’ and potentially mid-size retailers’ inventories.

Additional evidence of overstocking include reports that distribution centers and warehouses are currently operating at over 100% capacity. Many importers have leased trailers and parked them on their premises as additional storage capacity. Until the capacity utilization rate falls below 100%, it is likely that destocking will continue.
In terms of the economic drivers underlying containerized imports, it is better to focus on Retailer and General Merchandise Stores sales forecasts as well as their inventories. GDP has not been a useful driver of imported container volumes. In the first half of 2022, GDP declined while container volumes grew. This will be discussed in a future column.
In the last few months, exports have recently begun to recover but remain below their average levels during the 10 years prior to the pandemic. There are several possible reasons for the decline during the pandemic. US containerized exports are mostly commodities like forest products, grain & oilseeds, animal protein, and minerals such as kaolin clay. Commodities are sensitive to the US dollar’s strength on foreign exchange markets. During the pandemic, the US dollar’s value rose in foreign exchange markets but started to decline in the fourth quarter of 2022. In addition to such macroeconomic issues, there have been logistics issues. Due to the need to prioritize cycling containers for imports as quickly as possible (US ports were operating at peak import capacity since the Summer of 2020), it appears that container availability for exports has been less than for imports. As imported container volumes decline, the availability for exports has been increasing. In the last few months exports have been increasing at double digit rates compared to the same month one year ago.

The outlook then, assuming there isn’t a severe recession, is for continued decline in imported volumes until the General Merchandise Stores’ inventories are back at targeted levels. For exports, as long as the US dollar reverts to its average level of the ten years prior to the pandemic and container availability remains adequate, it is likely that they will increase to the average levels of the ten years prior to the pandemic.
October 2022
An Avoidable Recession
Dr. Walter Kemmsies, Chief Economist
The Kemmsies Group
Many economists currently believe there is a solid chance we will enter a recession in 2023 because the Federal Reserve’s recent and anticipated interest rate increases, targeted at reducing the rate of inflation, will decrease consumer spending, while making no impact on the true drivers of inflation.
It is doubtful that the increases in the Federal-funds interest rate target so far have been effective against inflation and could potentially prolong the higher than targeted rate of inflation. The current track of target hikes could turn out to be the Federal Reserve’s third policy error in the last 50 years. The common element is that during those other times there were supply problems, for which the Fed’s kit does not have any effective tools.
Once again, the issue is misdiagnosis. The Fed is using tools for controlling inflation driven by excess demand when the root cause is really insufficient supply. Raising interest rates in 1982 made sense as a means of disrupting the wage-price spiral (this was caused in the 1970s by Cost of Living Adjustments or COLAs that used to be triggered by the Consumer Price Index increasing by more than 4%) by negatively affecting demand. In 2022 there is no wage-price spiral and the problem rests primarily with the supply side. So far in 2022 consumer spending growth has slowed and investment spending declined.
It is likely that the Fed’s actions will result in a recession that is wholly unnecessary. It didn’t – and doesn’t – have to be this way. The causes of the inflation that the Fed is trying to staunch are three pronged: Supply side disruptions, poor planning by the retail sector (some companies over-stocked as consumer spending patterns shifted), and energy costs soaring due to the Russian assault on Ukraine.
The largest contributor to the Consumer Price Index (CPI) is the cost of housing. As the Wall Street Journal recently reported (Oct. 19, 2022) … “America’s protracted housing shortage—Freddie Mac estimated that as of the end of 2020 the country was 3.8 million housing units short of what it needed—suggests there is plenty of work for builders to do.” The same article goes on to point out that “The danger is that over the long haul, builders’ pulling back [due to higher interest rates negatively impacting builders’ willingness to build] only exacerbates the home shortage. In the end, that might only put upward pressure on prices, rents and, ultimately, inflation. The sad irony is that rather than fixing America’s housing problems, the Fed’s actions might only make them worse.”
The other source of inflation is the price of frequently purchased goods, like food. Food prices have risen a lot in the last few years, but this is unlikely due to Americans eating a lot more. In addition to supply- chain and logistics issues plaguing the industry since the start of Covid, 2022 has been a tough year for agriculture, with floods, droughts, and forest fires all restricting industry production. Raising interest rates is unlikely to improve the weather for agricultural production.
Energy costs have also been a large contributor to inflation. However, it is doubtful that raising interest rates is going to resolve the Russia-Ukraine which lies at the heart of the energy price increases.
Professor Brad DeLong at UC Berkeley is quoted in an The Economist article (July 5th, 2022) stated that “In 1947 and 1951 the [inflation] problem went away by itself.” Not all inflation problems require heavy- handed interference by government agencies. The US is a market-based economy and after all the policy intervention since the 2008 bungling, it is time to let the markets do what they have done so well throughout US economic history.
The US economy’s supply side has been making progress, though uneven, in its recovery from Covid- induced disturbances. Declining spot rates for container shipments from North Asia to the US and an increase in the number of void sailings indicates that the end to the shipping chaos is in sight. The Fed’s policy of raising interest rates also needs to end.
JUNE 2022
Higher Interest Rates Are Unlikely To Reduce The Current Inflation Bout
Dr. Walter Kemmsies, Chief Economist
The Kemmsies Group
There are a lot of trends impacting the economy at the moment that need to be parsed in order to develop an outlook. Among these are: the impact of the economy’s supply side disruptions on inflation, the impact of the Russia invasion of Ukraine on fuel price inflation, and the possibly inappropriate Federal Reserve policy response. The “R” (recession) word has been thrown about both regarding the state of the US economy as well as that of the transportation industry. However, it seems that it may be premature to use such kind of language.
The transportation industry seems to still be operating at levels unprecedented before the pandemic. US ports seem to have a large number of vessels waiting offshore to get a berth. Demand for international container movement remains high but has come off peak levels as can be seen by ocean carrier spot rate declines for the Asia to North America tradelanes. Railroads are collaborating with the Surface Transportation Board to resolve network congestion. In some truck lanes there have been declines in tender rejection rates but they remain closer to historical peak levels. Summed together, these trends make It hard to conclude that the transportation industry is in recession at this point in time.
It is hard to conclude that the overall economy is in recession. Unemployment is at historically low levels. Consumer spending is growing but with spending on services out-pacing goods. This is part of the Great Rebalancing of consumer spending to previous patterns as shown in the chart below. Data from the TSA (Transportation Safety Agency) shows growing numbers of airline passengers being processed at US airports - further evidence of consumers becoming more interested in services like traveling. Maybe the shift from goods to services would be even greater if the airline industry did not have to cancel tens of thousands of flights since Memorial Day due to staffing shortages.
Shares of Consumer Spending on Goods Versus Services

Source: US Department of Commerce, The Kemmsies Group
Recent manufacturing data is also likely reflecting some easing of supply side pressures, possibly because of waning consumer interest in goods. The widely followed June Manufacturing PMI® (purchasing manager index) published by the Institute for Supply Management (ISM) registered 53%, down from its reading of 56.1% in May. Any reading greater than 50% is associated with growth in the overall economy. “The June figure indicates expansion in the overall economy for the 25th month in a row after a contraction in April and May 2020,” according to the ISM. Two ISM sub-indexes deserve more attention:
The New Orders Index reading of 49.2 percent lower than the 55.1 percent recorded in May, indicating that retailers’ sales are declining, and their inventories are increasing.
The Backlog of Orders Index registered 53.2 percent, below the May reading of 58.7 percent, indicating that manufacturers are likely catching up with past orders.
Thus, the ISM data shows a loss of growth momentum in line with other data for goods producing industries. Some of this is due to consumers shifting their buying from some types of goods, notably those used for activities at home, to goods used when not doing things from home, like business clothing.
It is clear that consumer inflation is a result of supply side problems, such as labor and transportation equipment shortages, as well as higher fuel prices at least partially due to the Russian invasion of Ukraine. Fuel costs for trucks are impacting small to midsize operators severely causing cash flow issues. The unemployment rate is at a historically low level. These are supply side problems for which increases in interest rates, that primarily impact the demand side of the economy, cannot possibly resolve. For smaller companies, the interest rate increases worsen their precarious financial situation. If anything, higher interest rates are likely to discourage investment in sorely needed capacity increases that would help lower inflation.
Fortunately, the current interest rate target the Fed set is not too high so we can still avoid an unnecessary economic recession.
But we cannot avoid a freight recession. The days of doing almost everything from home are likely over and eventually, if not already, abnormal levels of purchases of imported retail goods will subside.
MAY 2022
RECESSION OR RECOVERY?
Walter Kemmsies, Chief Economist
The Kemmsies Group
In the last several weeks there has been a lot of news and data that have been negatively interpreted. But there is room for more interpretation - maybe the correct “R” word to describe the situation is recovery.
Beyond the focus on high inflation and the Ukraine invasion, the list of negative news and data includes negative first quarter GDP growth, data indicating declining truck and ocean carrier rates, slowing residential real estate demand, retailers reporting declining e-commerce and bricks and mortar store sales along with increasing inventories, and economists have raised their estimates of the probability of a recession occurring within the next 6 to 18 months. Some commentators have gone on to claim that the US is already in recession.
It’s no wonder that the stock market declined by double digits, led by consumer stocks.
But does all this mean the US economy is either in a recession or about to enter one? To gain some perspective, it’s important to look back to when the policymakers began to react to the Covid Pandemic. In March of 2020 most states shut down their economies and the federal government began a series of trillion dollar cash distributions to almost all citizens called fiscal stimuli. Many states started reopening their economies in late April but mostly in limited ways.
Even as the economy reopened, most companies allowed their employees to work from home, if they could. Schools were mostly closed, and they attempted to “school from home”. Being stuck at home, with a lot more cash to spend resulted in a surge of spending, as shown in the chart below. Presumably a lot of those goods were needed for the new “from home” lifestyles, such as furnishings and electronics.
Retailers sales in 2021 were 21.4% higher than in 2019, reaching a level that the historical trend lines indicated would be more likely to occur in 2025 or later. Since most of what Retailers sell is imported in containers and containerized imports are 50% of the larger US ports’ volumes, port gateways became and stayed congested because inland distribution networks that consist of ports, trains, trucks, and warehouses simply could not expand throughput capacity by 21% within two years.
To make matters worse, transportation companies decided to “early retire” and fire their employees when the economy first shut down. This overreaction to a short term economic shutdown exacerbated the problem, especially since some segments like railroads had already trimmed staff in pursuit of precision scheduled railroading. It is no surprise that congestion in every segment of transportation emerged. The scarce capacity of the system was allocated by soaring prices.
In January 2021, the first anti-covid vaccines were made available to the public. Throughout the year vaccination rates increased and in the second half of 2021, macroeconomic data shows that consumers had started to increase their spending on services faster than on goods. Thus, the third quarter of 2021 marked the beginning of the transition to a post-pandemic economy.
One thing that helped support spending on goods was residential real estate demand. Residential real estate sales are very correlated with containerized imports of household goods and furnishings. After peaking in 2006, new house building starts and home sales dropped well below their long-term averages, and container volumes in San Pedro Bay declined precipitously.
When the economy shut down in 2020, the Fed reacted by setting the overnight interest rate equal to zero, which caused longer term interest rates, including mortgage rates to decline to historically low levels. Therefore, while consumers started spending more on services in the latter half of 2021, they continued to spend on goods, particularly for homes. As it became clear towards the end of 2021 that the Fed was going to have to raise interest rates significantly, potential home buyers rushed to get financing and purchase a home.
Data for the last few months shows that residential restate demand growth has slowed as the Fed continued to raise the overnight Fed Funds Interest Rate in 2022. New house building stats have been flat in the last few months, at a level well below that of the 2006 peak. While existing home sales declined in April, the median price of single-family homes rose to surpass $400,000 for the first time ever.

As residential real estate demand slows, so will demand for household furnishings and appliances. That would slow demand for transportation services. Lower transportation costs will lessen the inflationary pressures the US has had.
In March and April of 2022, while headline inflation remained at a high level, the core inflation measures (estimated by taking volatile food and energy out of the measure of inflation) have been declining.
If the Fed gets it right, it may be possible to slow residential real estate growth and thereby inflation.
The decline of consumer spending on goods likely reflects the transition towards the post-pandemic economy. Prior to the pandemic, people spent a lot of time on leisure and travel. They didn’t stop that because they changed their preferences but because they were prevented from doing what they wanted to. A cursory inspection of the stocks and industry sectors that saw the largest decline in prices were primarily benefactors of the pandemic and the economic policy reaction to that.
The big question is how far can the Fed lower inflation? The unemployment rate is below 5%, the level that economists believe is necessary for new companies to be able to grow and hire employees. The working age population declined in the last few years and recent Census data indicates that the growth of this 16 to 64 year old segment of the population will be very low. With more help wanted ads than unemployed workers, the labor imbalance will continue unless there is a change in US immigration policy.
A slowdown in consumer spending has been reported by some of the largest retailers a few weeks ago. This could mean that segments of the transportation industry that tried to expand a lot in the last few years may find it necessary to delay the receipt of additional equipment they ordered, maybe even cancel the orders. Such behavior will be the greatest indication that the post-covid transition is stabilizing.
MARCH/APRIL 2022
Covid Supply Chain Chaos Endgame
Walter Kemmsies, Chief Economist
The Kemmsies Group
Both top-down (macro) and bottom-up (industry) data are in indicating that the Covid-19 pandemic- driven supply chain chaos is coming to an end. The transition towards a more stable environment hasn’t been smooth, nor should it have been expected to be so. The distribution of Covid-19 vaccines across different countries, and the shares of populations that were willing to be vaccinated in different countries have not been uniform. Other shocks like Russia’s invasion of Ukraine and the expiration of the ILWU contract in June may also be contributing to supply chain volatility.
Big changes are rarely the result of a large number of smaller things all changing at the same time – the odds of that happening are like the probability of flipping say five coins and all of them turning up heads or all tails. It could happen but that it very unlikely. For global supply chains to have been disturbed as much as they have been in the last few years, it is likely the case that one, or at most two, large thing happened.
The best candidate for a driver that can change enough to cause global supply chain chaos is consumer spending behavior in the world’s largest economy. This is especially true for the US port industry, since loaded imported containers at the largest port gateways average about 50% of total volumes and retail goods account for the majority of the contents.
The chart below shows the shares of US consumer spending on goods and on services quarterly from 1950 until the last quarter of 2021.

While consumers have been growing their expenditures on both goods and services since 1950, the data clearly shows that spending on services has been growing faster than on goods for the last seven decades. The trends have not been perfectly smooth, particularly during the 2008 to 2009 recession where the share of spending on services increased suddenly but then eventually returned to the trend level.
When the economy shut down in response to the Covid-19 pandemic in 2020, an even larger sudden shift in consumer spending patterns occurred than in 2008. Consumer spending on goods gained 300 basis points (31% share to 34% share) from the beginning of 2020 until the middle of 2021. Since the middle of 2021, when the economy began reopening in earnest, spending on services began to regain share from spending on goods. This shift in consumer spending parallels the trends seen in the growing restaurant, travel, and lodging industries’ activity.
Data on retailers’ inventories indicates that they are almost back to the same level as in early 2020. While it may seem that this implies that retailers’ operations have returned to near normal, sales are at higher levels than in 2020. Therefore, further inventory increases are likely needed to get them in line with sales.
Evidence of declining demand for container shipping services is beginning to emerge. One is example is declining spot container rates between China and Southern California which has been highlighted by some industry analysts recently. Another example is the dramatic reduction in the number of ships waiting to berth at the San Pedro terminals.
The decline in container shipping demand has been described as seasonal and to a large extent also as a result of China’s factory shutdown so as to reduce the spread of Covid there. That may be so, however, the macroeconomic data indicates there are more reasons for imported container volumes to be declining.
At some point the large, imported container volume increases had to end and revert to more normal trend levels. Most of the data and facts indicate that this is what is happening now.
It is likely that there will continue to be events or government actions that will, from time to time, extend or create instability of supply chains, such as the current lockdowns in China. These intermittent actions should become less frequent or significant over time. What will determine the trends are the longer term factors like reversion to service spending by consumers.
November/December 2021
2022 Outlook
Walter Kemmsies, Chief Economist
The Kemmsies Group
It’s that time of the year again when analysts and decision makers of all sorts gaze into the new year to discern macroeconomic trends that may create opportunities and challenges. There are a lot of published surveys of forecasters and reports on the economy to look at during this time of the year. The focus in this column is on summarizing where there is general agreement and dissent among the analysts.
Inflation-adjusted (aka Real) Gross Domestic Product is a good place to start. In the first quarter of 2020 as the economy started shutting down in March, GDP fell a little and in the second quarter of 2020, GDP dropped by double digits. As the economy reopened in the third quarter of 2020, GDP rose by double digits but did not regain its previous peak level of the fourth quarter of 2019 until the third quarter of 2021. The strong rebound and sustained GDP growth above the 2% level it has averaged since 2000 from the middle of 2020 until the middle of 2021 was driven by several trillion dollar fiscal stimuli and expansionary monetary policy in the form of the Fed lowering interest rates and dramatically increasing liquidity.
As unemployment continues to trend down, the need for further fiscal stimulus and expansionary monetary policy is declining. Given that inflation indicators such as the Producer Price Index have been rising by over 20% while the Consumer Price Index is now above 7%, it is not surprising that the Fed has started to step back from expansionary monetary policy.
The consensus view can probably be summarized as: GDP growth is going to slow over the balance of 2022 because it is unlikely that the Federal government is going to engage in further stimulus spending and that the Fed is moving away from expansionary monetary policy. Consensus forecasts are for low single digit inflation in 2022 but the inflation forecasting track record for economists is not very good. The Fed seems to continue to believe that the rise in inflation is temporary rather than a long trend but it has sounded less and less confident in that. For now what matters is that the Fed is not giving the slightest hint of when and if it would engage in contractionary policy.
Given that across the board operating costs for business (commodities, transportation, real estate and especially labor) are higher than in 2019, it is likely that companies will continue to pass at least some of their costs on to consumers. It is popular to blame the international supply chain for the cost pressure on inflation but data on wages in many urban areas indicates that labor is the fastest growing sustained business cost. If wage increases lead to sustained increases in consumer goods’ prices (a wage-price spiral like in the 1970s), the Fed may find itself forced to engage in contractionary monetary policy.
One of the key data points to watch regarding the outlook for next year concerning labor. Economists expect unemployment to continue to drop but their views on wages are not generally reported. Wage growth may become, if it isn’t already, a key focal point for the Fed. If the infrastructure policy kicks into action before the end of next year, it may add to upward pressure on wages.
As economic growth slows in 2022, it is likely that retailer sales will also slow, and potentially even contract a bit. That would help alleviate the pressure on supply chains. If that happens, it appears at this stage that the decline would not be substantial. Such a “Goldilocks” outcome for 2022 remains well in the domain of possibilities but not as well as it did a few quarters ago.
September/October, 2021
WILL THERE BE A SOFT LANDING?
Walter Kemmsies, Chief Economist
The Kemmsies Group
There are many reasons to be concerned about inflation risk. For one thing, every single cost of doing business has increased. With demand for freight movement services in every segment from ocean shipping to intermodal to trucking running significantly higher than available capacity, the price mechanism has been working overtime to allocate very scarce capacity. Spot prices in all freight movement segments have increased substantially. And it’s not just container freight rates from Northeast Asia to the US and Northern Europe, even the Baltic Dry Freight index just recently peaked at the third highest level since 2005. Wages have been increasing at double digit rates in many industries over the last 12 months or so. Industrial real estate lease rates have increased to unprecedented levels in most, if not all, port cities. To top it off, oil and refined products such as gasoline, diesel and bunker are at their highest levels since 2014.
In each of the last months since May 2021, both the Consumer and Producer Price Indexes have increased significantly compared to the same month one year ago, with the Producer Price Index (an index of prices of commodities used to produce goods and services) registering significantly higher gains. This is shown in the chart below. Since the mid-1980s the volatility of the CPI has declined relative to the PPI. This is likely due to consumer spending on services growing faster than on goods. Until the April 2020 shut down at least. But the primary cause is likely the substitution of cheaper imported goods compared to domestic produced goods, which would pull the CPI if companies pass on their cost savings (they usually do).

Federal Reserve officials have described this as “temporary”. However, some pundits have pointed out that in the past there have been long periods of higher inflation which at the time were attributed to Federal Reserve monetary policy stimulus and to special circumstances such as wars in the Middle East or the Residential Real Estate crisis, which some describe to be the result of a Federal Reserve policy error.
The chart above indicates that companies have surprisingly generally not yet tried to pass on their higher costs to consumers – since the PPI is rising a lot faster than the CPI. It should be noted that food producers have been passing their cost increases on – check your grocery bill. After 12 years of price competition, we have not fully seen a return to cost-plus-pricing. That is, if a company is asked to do or make something for another company, they price it at cost plus a mark-up. But with the cost pressures, we are likely to see a sustained period of at least moderately higher inflation.
Usually, the inflation cycle comes to an end with a recession, often engineered by the Federal Reserve via higher interest rates and the money supply. If importing companies are forced to start passing on costs, the Fed will likely react by doing exactly that. Such recessions are usually shallow and short-lived.
Of course, if the supply chain congestion can be resolved before companies start to pass on costs, then maybe the Federal Reserve won’t be under too much pressure to engage in contra-cyclical policies. It might be up to FuturePorts and other Port gateways to make the difference.
AUGUST, 2021
WHO WOULD HAVE PREDICTED THIS?
Walter Kemmsies, Chief Economist
The Kemmsies Group
It is hard not to keep focusing on the number of vessels anchored offshore waiting for a berth at some North American ports. There has been significant press coverage of this from a wide range of angles. However, the problems of the freight movement industry are not isolated to the ports but across all segments, from ships to ports to trucks and to trains, because the throughput capacity cannot be increased very quickly or easily.
The chart below shows monthly retailers sales (not overall retail sales, which includes food and gasoline, but instead sales of stores and e-commerce), not seasonally adjusted. The fourth quarter holiday seasonal peak is very evident in the spike that occurs every year in December.

The trough in the first quarter of 2020 was slightly lower than usual because the US economy began shutting down midway through March. The steep decline in retailers sales occurred in April but as the economy began reopening in May and with households flush with stimulus money, the sales began surging. The second half of 2020 saw higher retailer sales the second half of 2019. December 2020’s level was 7% higher than December 2019, which in turn had grown 5.5% over December 2019.
Many ports were handling record volumes in the second half of 2020 and really needed the seasonal lull in December and January to get sorted. That didn’t happen. The 2021 stimulus checks impacted consumer spending so that retailer sales from March to July (last data point) have been higher than the peak December 2020 sales. Year to date retailer sales are 21% higher than in the same time period in 2020. This has never happened before. No one predicted that.
Port and container volumes closely reflect the pattern of retail sales. Many ports have been reporting double digit increases in container volumes handled – driven by the three things: ongoing consumer spending, inventory rebuilding and storing Christmas merchandise as early as in May this year.
The American Association of Railroads’ weekly traffic data shows that for most weeks in 2021 so far, the intermodal volumes have been higher than 2019 and 2020. It has been a hard year for railroads too, starting with extremely cold weather in most of the country last February.
All sorts of efforts to increase the capacity of the global container fleet, container terminals and railroads, while dealing with a structural truck driver shortage and Covid-19 infections, are being undertaken. But even in the best of times the international freight system would be unable to increase capacity fast enough to meet the relentless surge of consumer spending. All types of carriers have been ordering more of all types of equipment and new transportation workers are being trained
Any company manager who might have tried to increase their company’s capacity by large double digits before the pandemic would either have been fired or filed for bankruptcy.
Some companies have stated that rising commodity and transportation prices are creating inflation that impacts their financial performance. Prices are doing their job, which is to allocate scarce capacity.
In a Wall Street Journal article “How the U.S. Nailed the Economic Response to Covid-19”, published on September 17, 2021 there was a discussion of all the policy moves that prevented an even worse economic collapse and is now resulting in better economic data. The article did not cover how the vital freight transportation industry should have been supported. Perhaps the title should have been How the U.S. ALMOST Nailed the Economic Response to Covid-19.
July, 2021
Is This The Right Time To Change The Rules?
Walter Kemmsies, Chief Economist
The Kemmsies Group
Every link in global supply chains is stretched beyond recognition. This has resulted in a lot of frustration and calls to change how the international freight movement industry operates. While there may be room for improvement this is not the time.
The global Covid-19 Pandemic has accelerated many long term trends, ranging from increasing e-commerce sales’ share of retail sales to rising retirement rates – particularly for the transportation sector. During the pandemic, airline pilots, truck drivers, railroad workers, among others, chose to retire since the pandemic began. In some cases early retirement was offered, especially during the first few months of the pandemic. However, many people have 401Ks that benefitted significantly from recent stocks market performance, which likely motivated decisions to retire. The shortage of properly skilled labor is acute across all transportation modes now, and particularly so for international freight movement – particularly for ports and terminal operators. The current situation has prompted a lot of commentary and prescriptions for new policies. Some of these policies could turn the US port system into something akin to the Amtrak rail system.
Before proposing a solution, it is important to diagnose the problem. The solution can then be described as follows: focus first on containerized imports, which account for >50% of total volumes in almost all these major port gateways. Somewhere between four fiscal stimuli in the $trillions and the need to adjust lifestyles during the pandemic, retailers’ sales are at levels that prior to the pandemic one would have forecasted to occur in 2026. Inventories have fallen to 2016 levels; this leaves retailers’ inventories-to-sales ratios at an all-time low. This is shown in the chart below.

It is not surprising that some store shelves are bare and deliveries are often delayed. Retailers are struggling to meet current demand and simultaneously rebuild their inventories. They are also dealing with a higher proportion of retail sales originating online. The e-commerce channel now accounts for 13.6% of retail sales (excluding cars and gasoline), an increase of 2.2% from the 11.4% recorded in 2020-Q1. Since more warehouse and distribution space is needed per dollar of e-commerce sales compared to brick and mortar store sales, there has been a large increase in demand for industrial real estate, especially near ports.

Between the large sudden increase in e-commerce sales and because of difficulties in moving goods from ports to inland locations due to insufficient transportation workers, and the shortage being made worse by covid infections among these workers, warehouse and distribution demand near ports significantly exceeds supply. The industrial real estate vacancy rate is below 2% in the largest US port gateways, according to some real estate service providers. Some companies are trying to store their goods in containers, trailers and anywhere else they can find space.
To sum up, there are three forces at work now. (1) A sustained surge in consumer demand, (2) labor shortages in the US and in key import source countries such as Vietnam and China, (3) transportation worker shortages. The transportation worker problems include sailors stranded on vessels well beyond their usual three month shifts because of difficulties with international travel.
Under these circumstances it is not surprising that a lot of things are going wrong from in every segment of the supply chain – from producing goods to shipping and delivering them to factories, stores and homes. This is exposing pretty much every flaw in the transportation and logistics industries.
Since the West Coast has borne the brunt of the chaos, it is worth looking at some performance indicators. It should be noted that East Coast ports and terminal operators have stepped up significantly to absorb the tsunami of containers. Ports on both coasts have been handling above previous peak volume levels every month since August 2020. Some salient statistics for West Coast port and terminal operators’ operations (Note: The data was kindly provided by industry colleagues):
Local Delivery Dwell – average increase of 3.2 days
On Dock Rail Dwell – average increase of 9.75 days
On-Terminal Box Count Increase – an increase of 42%
This data doesn’t include chassis street dwell increases which have left some terminals out of chassis for most of the last 12 months. It also does not include shortages of all kinds of containers, primarily due to dwell at shippers’ facilities.
The Federal Maritime Commission is looking into what it can do to help improve the system’s efficiency. But that is not enough. There are other actions that supply chain participants can take in the short run and other actions that policymakers need to take.
The beginning place may very well be putting warehouses and distribution centers on a 24x7 schedule. It won’t help if container terminals/ports are open 24x7, if warehouses/distribution centers are not open to receive the containers arriving from the terminals.
Getting transportation and warehouse workers back to work at pre-pandemic levels is a primary concern. These workers are critical infrastructure. These workers who stayed on the job in rail, trucks and ports deserve a special mention. They kept the economy moving, otherwise we would have ground to a screeching halt.
In the short run there needs to be more communication – information sharing amongst all members in the supply chain. Participating port information portals and in the Digital Container Shipping Association platform would be a good start. Digitization of shipping data can significantly increase throughput capacity, just as variable speed limits all along the West Coast has improved traffic throughput capacity on the main highways and interstates. Larger companies usually have good network communication systems, but smaller shippers do not. It is time to help the lower volume shippers – collectively they ship a lot more containers than the 100 largest shippers. For sure there is more that can be done, but communication is always a top priority.
It is good to see that the US Department of Commerce has established the Office of Supply Chain, but this does not go far enough. The Office of Intermodalism needs to be re-established by the US Department of Transportation. Originally, the Office of Intermodalism had the responsibility for initiating and coordinating federal intermodal policy and was primarily focused on research and analysis. The scope of the Office of Intermodalism should also be increased from what it was originally to give it the ability to approve or stop specific projects.
Given the current economic and trade trends, government agency in the port and terminal industry outside of helping improve communication is ill-advised. The existing global trade logistics system was not built to handle simultaneous surges in demand and shortages of labor. Intervention could result in negative unintentional consequences that could worsen the situation for all shippers as well as transportation service providers. This is not the right time to formulate and impose new regulations.
June, 2021
Making Supply Chains More Resilient
Walter Kemmsies, Chief Economist The Kemmsies Group
As the World progresses through the Covid-19 pandemic, attention to the vulnerability of most industries’ supply chains has expanded beyond the domain of logistics professionals to discussions at families’ dinner tables. Logistics professionals are trying to figure out how to reduce their supply chain’s vulnerability to macro systemic events, such as a global pandemic, but also other catastrophes. However, some may be wondering whether such efforts are an exercise in futility because any solution to supply chain risk reduction will likely increase operating costs. As the world recovers from the pandemic, will some of these solutions be abandoned because of a cost cutting effort?
Unfortunately, there is no one size fits all solution. As an example, one proposed “solution” is to shorten supply chains for products sold in the US. “Shorten the supply chain” usually means manufacturers try to relocate production to the US or Mexico. The problem with this one size fits all recommendation is that if the manufacturing is not already occurring in the US or North America, it is probably because it is cost prohibitive. There are plenty of countries in Asia that have cheaper labor costs than North America. The federal government has begun to offer subsidies to companies in certain key industries in order to get them to start or increase their capacity to manufacture their goods on US soil.
Surveys of importers have indicated that many retailers intend to hold more inventory than in the past, around 5% more.. Much of this inventory is likely to be held closer to “rooftops”, meaning houses, stores, and factories. More storage space is needed, and many companies are currently engaged in increasing their warehousing footprint.
The critical element is to have a proper strategy to make supply chains more resilient at the lowest possible cost. Discussions with supply chain managers at importers, particularly importers of consumer goods, reveal that resiliency strategies have three key elements:
1.) A robust understanding of potential threats to the flow of physical freight, information and finance.
Physical freight flows – services such as Everstream Analytics, based on global information flows from DHL, is an example of how to get real time information on events that can disrupt freight flows.
Information flows – during the shutdown phase of the pandemic when people did not go into offices, large communication gaps within and in between companies created supply chain breakdowns. Key communication links need to be formally identified and documented on an ongoing basis.
Financial flows – monitoring the financial condition of customers and suppliers. There are many financial data companies that can help with that.
2.) Identifying assets that need to be made redundant.
These are generally put in four categories: locations, suppliers, service providers, and distributors. An example of this is port selection to diversify risk. Due to a range of issues at various ports around the country during the pandemic, some importers have announced that they will increase the number of port gateways they use. For example, some have decided to shift from only using or two ports to a “four corner” (NW, SW, NE, and SE) port use strategy or even a “five corner” (add the Gulf Coast). Furthermore, some importers will be contracting with more carriers partly because of the expansion of the number of ports they are using but also to have access to more capacity. More inventory held closer to rooftops, as mentioned above is another example of strategic redundancy.
3.) A strategic vision that includes comprehensive buy-in by senior management.
Senior management “buy-in” requires a strategy that can easily be explained to the board of directors and packaged for Wall Street analysts if the company is publicly traded. After all, it has been investors’ relentless focus on how companies manage their operating costs and how much capital is used that drove companies to develop supply chains that are more vulnerable to macro systemic events. The resilience strategy described here will increase operating costs but the increase should be viewed as an insurance expense. Insurance against stockouts which can result in a company permanently losing market share since consumers are likely to buy from their competitors.
Change is constant within supply chains, so while the pandemic has placed increased scrutiny on these changes, they may not be as dramatic as the new spotlight suggests. The smart logistic teams will consider taking a step away from sweeping cost cutting measures and chose to invest in a more robust strategic vision that is built on a comprehensive communication plan that accounts for changes with freight flows, financial conditions, and potential macro systemic events.
March, 2021
Repeated Whiplash for Ports
Walter Kemmsies, Chief Economist
The Kemmsies Group
The government and consumer response to Covid-19 as well as pandemic-induced factory shutdowns in countries where US importers source from have conspired to put tremendous pressure on importers, ocean carriers, container terminals, railroads and railroads. The most visible result being dozens of container vessels anchored outside San Pedro Bay since last November.
At the onset of the Covid-19 pandemic in May 2020, retailers’ sales plummeted as the economy shut down. As the economy reopened in May and the first stimulus bill was passed, retailers’ sales surged – as shown in the chart below. By July 2020, retailers’ sales exceeded their previous peak level reached in February 2020.
As retailers’ sales surged, their inventories plummeted. By June 2020, retailers’ inventories fell to the level of November 2015, a decline of 12%. Despite retailers’ best efforts to return inventories to previous levels, the torrid pace of sales, driven by a second stimulus, prevented that from happening. Retailers’ sales reached a historical peak level in January 2021 – the last data point shown in the chart above.
The inventory-to-sales ratio (the value of inventories held to support $1 of sales) for retailers shows how unstable the last 12 months have been. The I/S ratio had declined from $1.70 of inventories per $1 of sales in the early 1990s until $1.35 by the early 2010s when e-commerce became competitive with brick and mortar sales. As e-commerce sales grew faster than bricks and mortar sales, the I/S ratio increased – for e-commerce to compete with bricks and mortar, more inventory has to be held in more places. The I/S ratio had stabilized in the $1.45 to $1.50 range in the 2015 to 2020 period. During the Covid-19 pandemic, the I/S ratio first spiked to almost $1.70 per $1.00 of sales before plummeting to the lowest level ever. With the I/S ratio at $1.20 per $1.0 of sales, it is clear that there are simply insufficient inventories to support retailers’ sales.

The combination of the fiscal stimuli and consumers being forced to do more from home, as well as manufacturers struggling to fully staff their factories almost everywhere in the world except China has resulted in very high growth of imports from China. This growth has not been enough to meet consumer demand and retailers’ needs to replenish their inventories. With the inventory-to-sales ratio at $1.19 to $1.00 of sales, there are stockouts of various of consumer goods around the country and nationally for some goods.
The media reports that in some parts of the US there are appliance shortages and furniture order delivery backlogs that are lasting up to six months. Other goods such as exercise equipment are also struggling to get their merchandise off ships anchored at sea and on their way to consumers. Consumers who may be hoping to get in shape before taking a beach vacation this Summer may be pressed for time to do so.
Given that China appears to be the only country that has returned to 100% manufacturing capacity, the SoCal gateway is in the bullseye for stock replenishment for a significant part of the country. The firehose of imported container volumes has been overwhelming due to Covid-19 driven constraints as well as other structural gateway issues, and despite various countermeasures such as opening additional gates at marine terminals. Hence, ships have been diverted to other gateways to reduce the pressure in SoCal.
When will the pressure subside? Given that US ports have been under nonstop peak season type pressure since the third quarter of 2020, one can hope that once enough people have been vaccinated, consumer spending will shift back to services, which will allow retailers to rebuild their inventories to levels where there are fewer stockouts and delivery delays. That may not occur until the Chinese Lunar New Year lull in 2022.
February, 2021
Residential Real Estate Trends Supporting Port Container Volume Growth
Walter Kemmsies, Chief Economist
The Kemmsies Group
In 2020, the tonnage of imported goods in containers increased 1.4% over 2019, however, as we all know, it was a tale of two halves. The first half saw double digit declines at most ports and the second half saw a growing surge that eventually brought overall import volumes barely above the previous year. Not all ports benefited, but available data indicates that the larger ports in the “four corners” did better than the smaller ports.
Growing e-commerce sales driven by consumers who did not lose their jobs and who shifted from doing things (like eating out, etc.) to buying more things to do from home are part of the reason for the unexpected surge of imported container volumes in the second half of 2020. However, trends in the real estate sector have also had an effect on imports.
The chart below shows annualized monthly housing starts data going back to 1960. The long term average is approximately 1.4 million annual new home starts. During the 2001-2006 period, interest rates were exceptionally low, and banks were encouraging people to buy homes so that they could repackage the mortgages as collateralized mortgage obligations (effectively long term bonds) to sell to investors seeking higher interest rates than available in the bond market. Existing home sales and new housing starts peaked at a 2.3 million annual rate in January 2006 and then plummeted to 478 thousand starts in 2009 – the lowest level in 50 years.

The decline in residential real estate activity severely impacted container ports’ volumes. Container volumes dropped significantly at the San Pedro Bay ports beginning in 2006 and didn’t recover their former peak level until 2016. Inspection of imported containerized goods indicates a growing share of items related to increases in home purchases and new house construction starts. These items include furnishings, furniture, appliances and a range of other commodities used in the construction of houses.
The only sector that increased construction since 2019, in the commercial real estate market, is the industrial market which includes distribution centers, warehouses and factories. The big drivers of that are the increase in e-commerce sales and government efforts to get companies to produce more critical commodities on US soil.
It is likely that residential real estate demand will remain strong even after herd immunity from Covid-19 is reached this year for several reasons.
- Pent up demand: There are many people who are likely to have to move to another location in order to start a new job. The retirement rate for Baby Boomers doesn’t appear to have peaked yet and this drives demand for retirement homes in the Southwest.
- Low financing costs: Mortgage rates are at the lowest levels in decades. They are likely to rise from current levels as long term interest rates begin to rise from the depths to which they plunged in March 2020. However, with inflation running below the Federal Reserve’s target average rate of 2%, it might take some time for the Fed to aggressively raise interest rates.
Although inflation is low, it is worth noting that construction-related commodities’ prices have risen dramatically in the last 18 months. Lumber prices are at all time high levels and many metals such as copper, aluminum and steel are either at or near all time highs. Energy commodity prices have also increased since last year. To see the price charts, check out tradingeconomics.com. It’s possible that the high commodity prices are due to insufficient production capacity because of the impact of the pandemic on operations. If so, the commodity price increases may reverse some. If not, then inflation could pick up enough to prompt the Fed to raise interest rates and thus reduce the demand for real estate. That in turn would likely have a negative impact on imported container volumes. Until then it is unlikely that containerized imported goods into the US will decline.